“Most of the world will make decisions by either guessing or using their gut. They will be either lucky or wrong.” [credit: Suhail Doshi, CEO of Mixpanel]
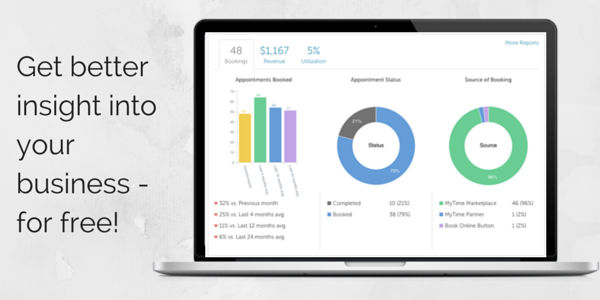
Today, your MyTime Merchant Dashboard truly became a fully robust dashboard, giving you more visibility into your business, customers, and revenue. We are now analyzing all the data we have about your business and displaying it in a way that is useful and easy-to-use.
Both the Dashboards and Reports are free for all MyTime businesses, but they will be especially useful to those using MyTime Scheduler, since it will provide a more complete picture of your business.
Here are just a few things you can do with Dashboards & Reports:
Analytics
The top section of the Dashboard features charts on your Bookings, Revenue, and Utilization. You can even filter the data by Location, Staff, and Time Period.
Bookings Tab – See how many appointments you’ve booked and which sources are driving your revenue.

Revenue Tab – See which services bring the most revenue and how much you earn from new vs. existing customers.

Utilization Tab – See which days and times are your busiest…and your slowest! You can always fill your slow times with Happy Hour Pricing. (Learn more)

Reports
Click Reports, and you will find our powerful reporting feature. Here, you can run reports on Bookings & Revenue, Clients, and Staff.

The individual reports can be filtered and sorted. In the example below, you can sort your staff by their average customer rating!

We hope you enjoy your new Merchant Dashboard, and all the extra insights about your business!
As always, don’t hesitate to reach out to our Customer Experience Team if you have any questions, comments or concerns. Reach us: